


Photo Credit: Yakobchuk Viacheslav / Shutterstock
The summer job was once a rite of passage for teenagers and young adults, but this tradition faded significantly by 2020. Beginning in the late 1970s, teen labor force participation experienced a long-term downward trend that plunged in the 2000s. Multiple factors have contributed to this dip in teen employment, including an increased emphasis on school, more demanding high school coursework, and higher rates of borrowing to pay for rising college tuition. The focus on higher education may have also shifted summer priorities for teens from making money to building up their resumes.
Prior to COVID-19, this decline was expected to continue in the coming years. Yet research from Pew showed the summer of 2021 was actually the strongest in years for teen workers, marking an abrupt reversal of this long-term trend.
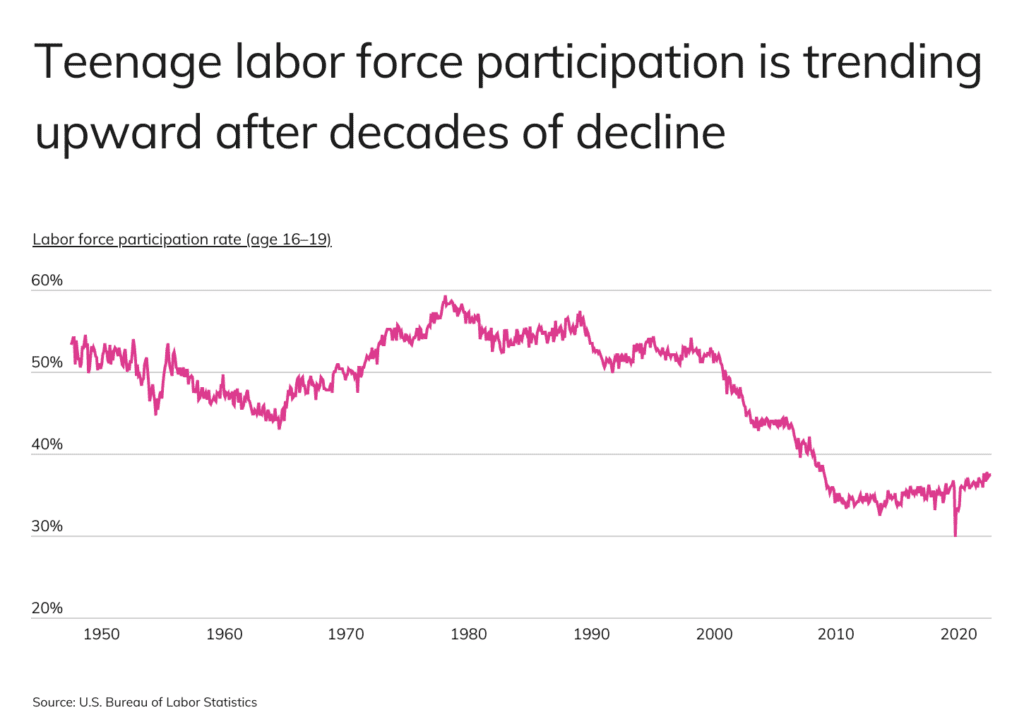
During the 1960s and 1970s—amid the post World War II economic boom—teen labor force participation increased steadily, hitting a peak of 59.3% in August of 1978. However, this rate gradually decreased throughout the 1980s and 1990s and experienced a significant decline in the early 2000s. By May 2011, the teenage labor force participation rate had plummeted to a mere 33.3%.
Although there were slight improvements following the Great Recession, it wasn’t until the COVID-19 pandemic that the demand for teenage workers increased significantly. Following the initial lockdown period, many adults were hesitant to return to work due to health concerns, childcare issues, and challenging customer interactions. Teenagers filled in these job vacancies, and as a result, the teenage labor force participation rate began to grow, sustaining levels not seen consistently since early 2009. With ongoing labor shortages continuing to plague the service sector, the teenage labor force participation rate has continued to grow and reached 37.4% in March 2023.
LEARN MORE
Why settle for ordinary when you can have a fun and unique job, like one that keeps you outside or allows you to work with kids? Cool Jobs has an extensive collection of fun job listings, including summer camp jobs which can be great for building your resume.
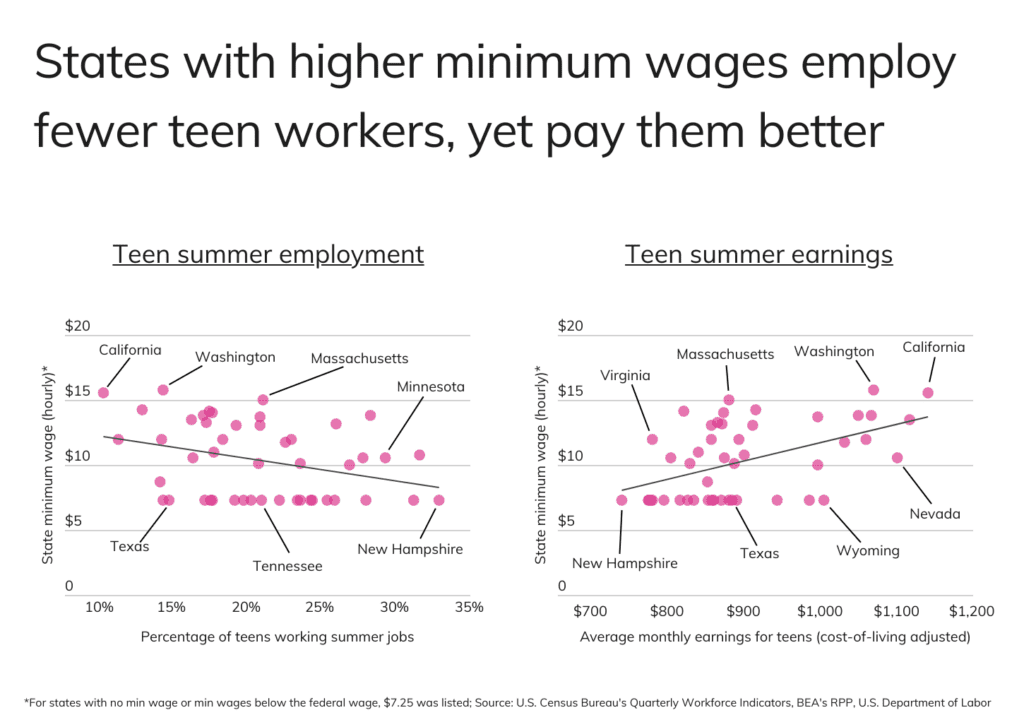
While teenage labor force participation is up nationally, data from the U.S. Census Bureau shows that a greater proportion of teens tend to work summer jobs in states with lower minimum wages. In fact, research from the Congressional Budget Office suggests that each 10% increase in minimum wage results in a 0.7% decrease in teenage employment.
The relationship between raising the minimum wage and teen employment is a complex and contentious issue. While proponents point to its positive effects on reducing poverty, opponents of minimum wage increases argue that higher wages entice older workers to apply for roles where teenagers are typically employed, thereby increasing competition. Further, as labor costs increase, employers may be less willing to hire and train less experienced and less productive workers, such as teens.
At the state level, New Hampshire has the highest percentage of teenagers working summer jobs at 32.9%, followed closely by South Dakota and Wisconsin, with teen employment rates of 31.6% and 31.2%, respectively. Both New Hampshire and Wisconsin have minimum wages set at $7.25 per hour, matching the federal minimum, while South Dakota currently offers $10.80 per hour. Meanwhile, the three states with the lowest percentage of teens working summer jobs—California, Hawaii, and New York—all have state minimum wage laws that exceed $12.00 per hour.
Despite the lower rates of teen employment in states with higher minimum wages, the increased wages do benefit the teens who are able to secure work, particularly since many teens work jobs that pay at or near the minimum wage. For instance, California, which has the lowest rate of teen summer employment at just 10.4%, has the highest teen wages in the country at an average of $1,141 per month after adjusting for cost of living, due in part to its $15.50 per hour minimum wage.
RELATED
Working as a camp counselor is the ultimate summer job experience. Not only do you get to work outside, you get to be a role model for kids. And now is the right time to sign up. Take a look at these summer camp counselor jobs near you.
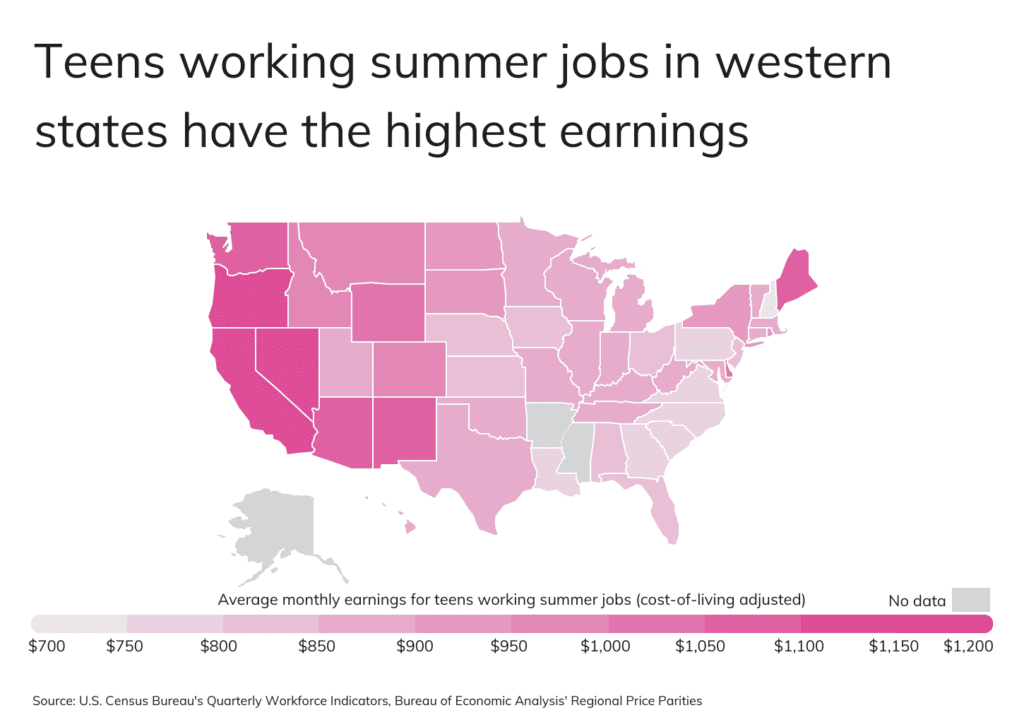
Regionally, teen summer wages largely mirror state minimum wage laws. In particular, states located on the West Coast and in the Northeast are more likely to have minimum wages that exceed the federal minimum, and consequently, teens in these states tend to earn more in their summer jobs, even after accounting for cost-of-living differences. For example, in addition to California, teens in Oregon, Nevada, Washington, and Arizona earn over $1,000 per month on average.
In contrast, states in the South and Midwest typically report lower summer wages for teens. This may be due to a variety of factors, such as lower minimum wage rates, local economic conditions, demographics, and cultural norms.
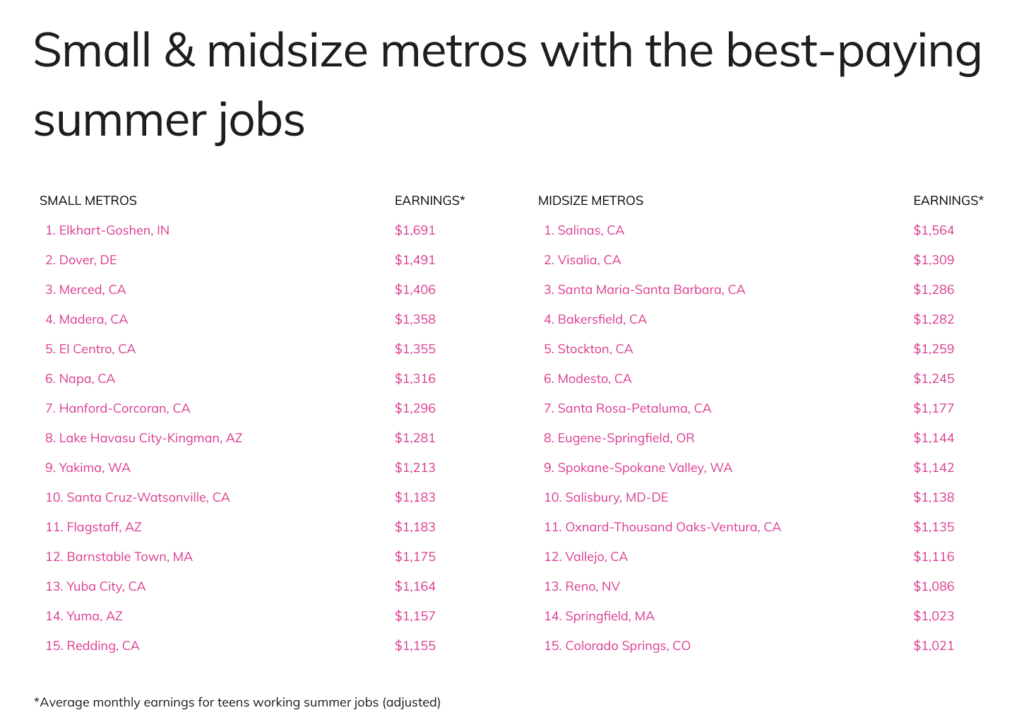
To determine the locations with the best-paying summer jobs, researchers at Cool Jobs analyzed the latest data from the U.S. Census Bureau, the Bureau of Economic Analysis, and the U.S. Department of Labor. The researchers ranked metropolitan areas by the average monthly earnings for teens working summer jobs after adjusting for cost of living. In the event of a tie, metros were sorted by the unadjusted average monthly earnings for teens working summer jobs.
Here are the U.S. metropolitan areas with the best-paying summer jobs.
Large Metros With the Best-Paying Summer Jobs

15. Austin-Round Rock-Georgetown, TX
- Average monthly earnings for teens working summer jobs (adjusted): $950
- Average monthly earnings for teens working summer jobs (actual): $950
- Percentage of teens working summer jobs: 15.6%
- Total teens working summer jobs: 24,868

14. Denver-Aurora-Lakewood, CO
- Average monthly earnings for teens working summer jobs (adjusted): $951
- Average monthly earnings for teens working summer jobs (actual): $1,038
- Percentage of teens working summer jobs: 21.4%
- Total teens working summer jobs: 41,279

13. Buffalo-Cheektowaga, NY
- Average monthly earnings for teens working summer jobs (adjusted): $955
- Average monthly earnings for teens working summer jobs (actual): $908
- Percentage of teens working summer jobs: 23.6%
- Total teens working summer jobs: 16,291

12. San Francisco-Oakland-Berkeley, CA
- Average monthly earnings for teens working summer jobs (adjusted): $997
- Average monthly earnings for teens working summer jobs (actual): $1,195
- Percentage of teens working summer jobs: 11.6%
- Total teens working summer jobs: 31,386

11. Seattle-Tacoma-Bellevue, WA
- Average monthly earnings for teens working summer jobs (adjusted): $1,012
- Average monthly earnings for teens working summer jobs (actual): $1,159
- Percentage of teens working summer jobs: 14.0%
- Total teens working summer jobs: 32,463

10. Phoenix-Mesa-Chandler, AZ
- Average monthly earnings for teens working summer jobs (adjusted): $1,046
- Average monthly earnings for teens working summer jobs (actual): $1,037
- Percentage of teens working summer jobs: 18.7%
- Total teens working summer jobs: 64,681

9. San Diego-Chula Vista-Carlsbad, CA
- Average monthly earnings for teens working summer jobs (adjusted): $1,046
- Average monthly earnings for teens working summer jobs (actual): $1,205
- Percentage of teens working summer jobs: 10.5%
- Total teens working summer jobs: 21,277

8. Tucson, AZ
- Average monthly earnings for teens working summer jobs (adjusted): $1,051
- Average monthly earnings for teens working summer jobs (actual): $977
- Percentage of teens working summer jobs: 13.4%
- Total teens working summer jobs: 9,019

7. Portland-Vancouver-Hillsboro, OR-WA
- Average monthly earnings for teens working summer jobs (adjusted): $1,097
- Average monthly earnings for teens working summer jobs (actual): $1,156
- Percentage of teens working summer jobs: 14.6%
- Total teens working summer jobs: 22,409

6. Las Vegas-Henderson-Paradise, NV
- Average monthly earnings for teens working summer jobs (adjusted): $1,109
- Average monthly earnings for teens working summer jobs (actual): $1,060
- Percentage of teens working summer jobs: 14.8%
- Total teens working summer jobs: 23,046

5. Los Angeles-Long Beach-Anaheim, CA
- Average monthly earnings for teens working summer jobs (adjusted): $1,138
- Average monthly earnings for teens working summer jobs (actual): $1,295
- Percentage of teens working summer jobs: 9.3%
- Total teens working summer jobs: 76,196

4. San Jose-Sunnyvale-Santa Clara, CA
- Average monthly earnings for teens working summer jobs (adjusted): $1,147
- Average monthly earnings for teens working summer jobs (actual): $1,281
- Percentage of teens working summer jobs: 12.4%
- Total teens working summer jobs: 14,850

3. Sacramento-Roseville-Folsom, CA
- Average monthly earnings for teens working summer jobs (adjusted): $1,152
- Average monthly earnings for teens working summer jobs (actual): $1,225
- Percentage of teens working summer jobs: 14.1%
- Total teens working summer jobs: 22,335
2. Fresno, CA
- Average monthly earnings for teens working summer jobs (adjusted): $1,243
- Average monthly earnings for teens working summer jobs (actual): $1,262
- Percentage of teens working summer jobs: 10.0%
- Total teens working summer jobs: 7,898

1. Riverside-San Bernardino-Ontario, CA
- Average monthly earnings for teens working summer jobs (adjusted): $1,267
- Average monthly earnings for teens working summer jobs (actual): $1,337
- Percentage of teens working summer jobs: 9.3%
- Total teens working summer jobs: 32,659
Detailed Findings & Methodology
To determine the locations with the best-paying summer jobs, researchers at Cool Jobs analyzed the latest data from the U.S. Census Bureau’s 2021 Quarterly Workforce Indicators and 2021 American Community Survey, the Bureau of Economic Analysis’ 2021 Regional Price Parities, and the U.S. Department of Labor’s Wage and Hour Division.
The researchers ranked metropolitan areas by the average monthly earnings for teens working summer jobs after adjusting for cost of living. Only locations with complete data available are included in the analysis. In the event of a tie, metros were sorted by the unadjusted average monthly earnings for teens working summer jobs.
Note that average monthly earnings for teens working summer jobs was calculated using private firm employment data from the start of Q3 2021 for employees age 14–18. Additionally, some state minimum wages are subject to stipulations based on establishment size, health benefit offerings, geography, or are tied to economic indicators like the Consumer Price Index.
To improve relevance, only metropolitan areas with at least 100,000 people were included in the analysis, and metro areas were grouped into the following cohorts based on population size:
- Small metros: 100,000–349,999
- Midsize metros: 350,000–999,999
- Large metros: more than 1,000,000